This function builds horizon plots in ggplot2. It allows for the customization of the origin and the horizon scale.
geom_horizon(
  mapping = NULL,
  data = NULL,
  position = "identity",
  ...,
  na.rm = FALSE,
  show.legend = TRUE,
  origin = "midpoint",
  horizonscale = 6,
  rm.outliers = FALSE,
  reverse = FALSE,
  mirror = FALSE,
  inherit.aes = TRUE
)

stat_horizon(
  mapping = NULL,
  data = NULL,
  geom = "ribbon",
  position = "identity",
  ...,
  na.rm = FALSE,
  show.legend = TRUE,
  inherit.aes = TRUE,
  origin = "midpoint",
  horizonscale = 6,
  rm.outliers = FALSE,
  reverse = FALSE,
  mirror = FALSE
)
Arguments
| mapping | Set of aesthetic mappings created by |
|---|---|
| data | The data to be displayed in this layer. There are three options: If A A |
| position | Position adjustment, either as a string, or the result of a call to a position adjustment function. |
| ... | Other arguments passed on to |
| na.rm | If |
| show.legend | logical. Should this layer be included in the legends?
|
| origin | Origin of the horizon plot. It can either be a string, namely
|
| horizonscale | Cutpoints of the horizon plot. It can either be an integer
specifying the number of ranges (default is |
| rm.outliers | If |
| reverse | IF |
| mirror | If |
| inherit.aes | If |
| geom | Used geom, default to 'ribbon' |
Value
'ggplot2' layer for building a horizon plot.
Details
A horizon plot is a special type of area plot in which the original data
is transformed based on an origin and a horizon scale. The data is cut in
different intervals, and the further the data is from the origin, the deeper
its color usually is. All the intervals above the origin are then stacked on
top of one another, keeping the intervals closest to the origin in the bottom
and the furthest away ones on top. Likewise, the intervals below the origin
are normally given a different color palette and they are stacked in a similar
manner in the same area as the intervals above the origin. You can learn more
about how horizon plots are built in vignette('ggHoriPlot') or at
https://bernatgel.github.io/karyoploter_tutorial/Tutorial/PlotHorizon/PlotHorizon.html.
Orientation
This geom treats each axis differently and, thus, can thus have two orientations. Often the orientation is easy to deduce from a combination of the given mappings and the types of positional scales in use. Thus, ggplot2 will by default try to guess which orientation the layer should have. Under rare circumstances, the orientation is ambiguous and guessing may fail. In that case the orientation can be specified directly using the orientation parameter, which can be either "x" or "y". The value gives the axis that the geom should run along, "x" being the default orientation you would expect for the geom.
Aesthetics
geom_horizon() understands the following aesthetics (required aesthetics are in bold):
xyxendalphacolourfill
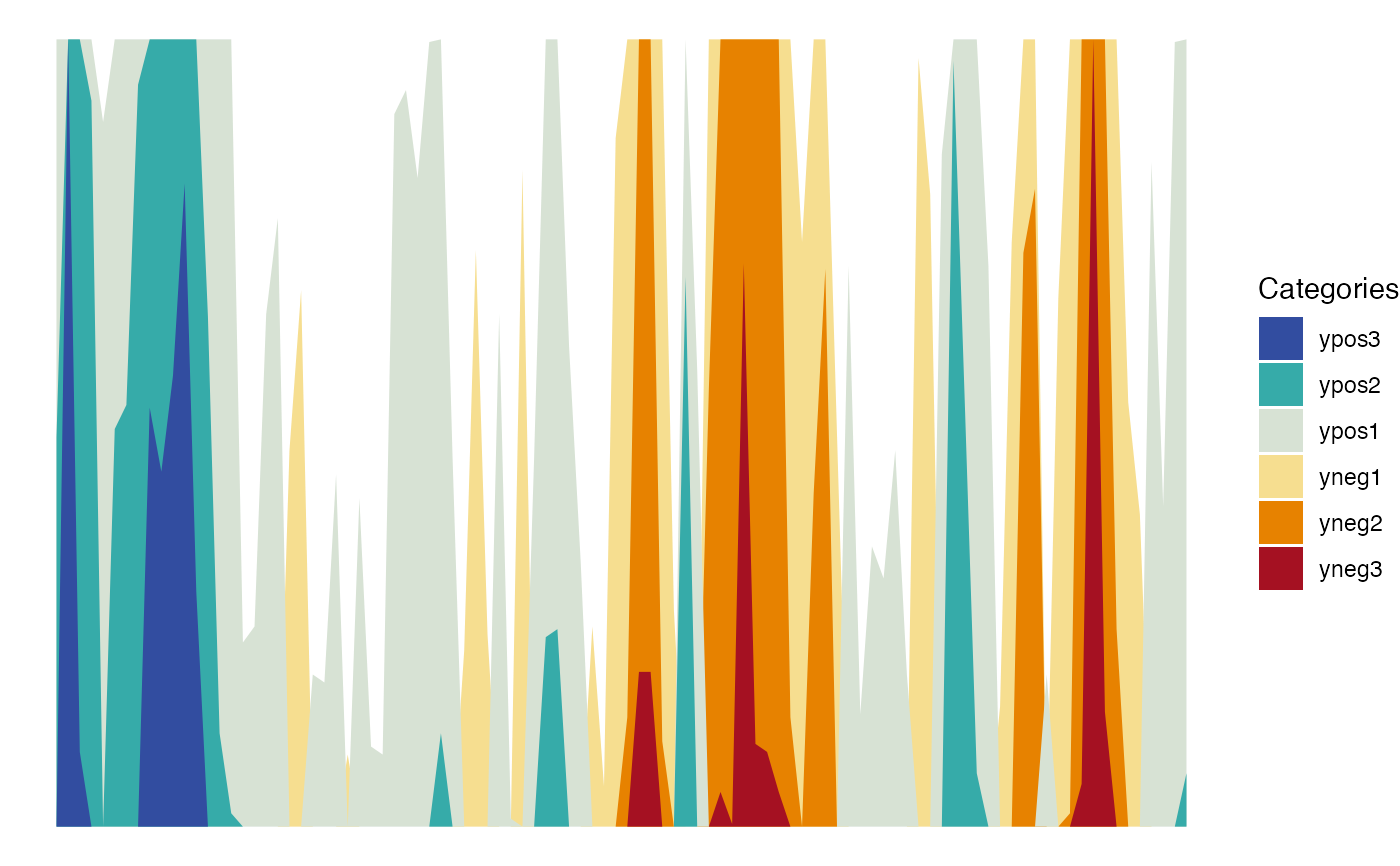
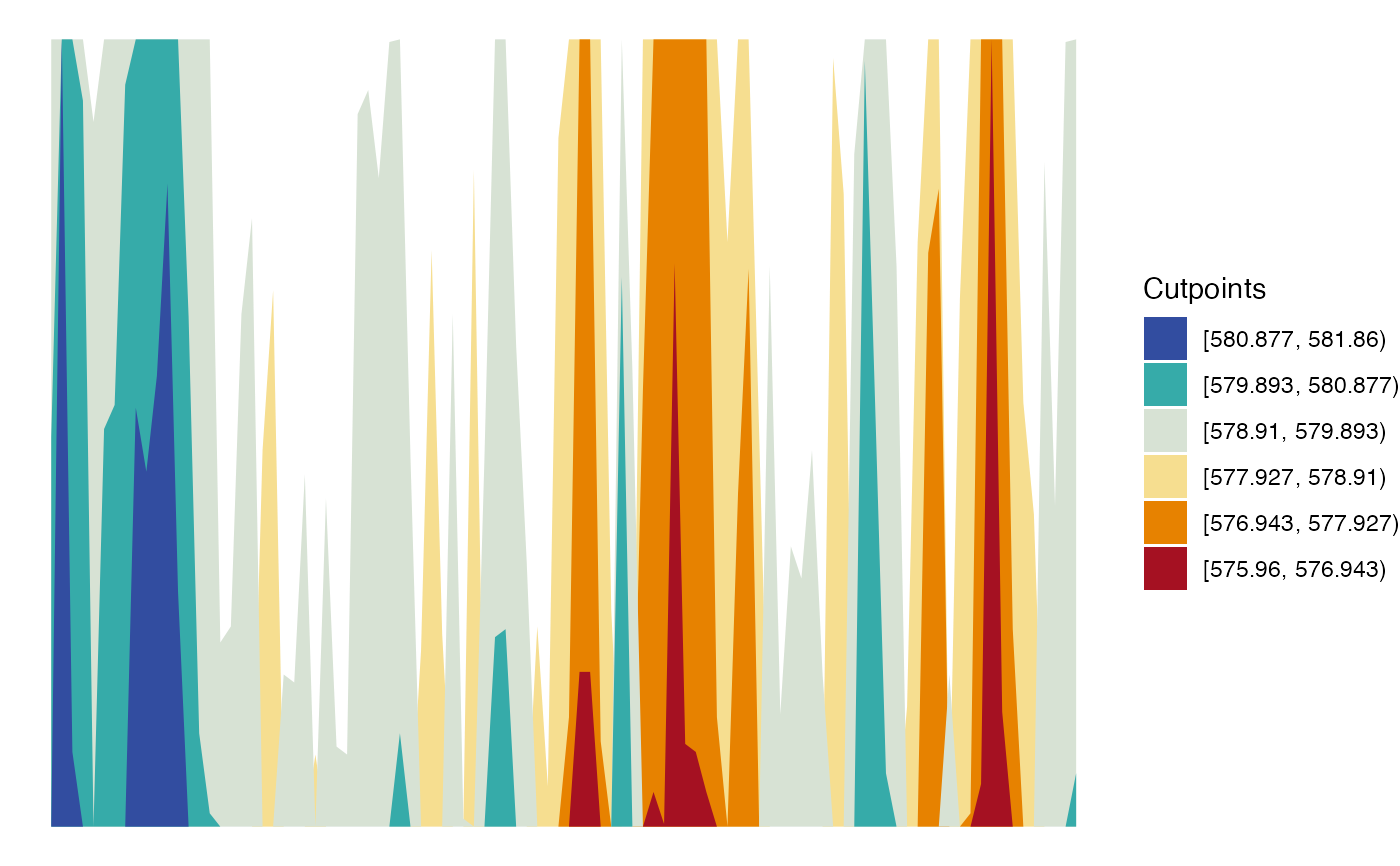
Examples
# Generate data huron <- data.frame(year = 1875:1972, level = as.vector(LakeHuron)) # Basic plot with default colors h <- ggplot(huron) + geom_horizon(aes(year, level)) # Add color scheme h + theme_void() + scale_fill_hcl()# Add cupoints ggplot(huron) + geom_horizon(aes(year, level, fill = ..Cutpoints..)) + theme_void() + scale_fill_hcl()